Before you can start investing you need to know a few basics. I have gotten a number of requests to write about tackling the idea of investing in a simple way. In this post, I am going to explain what a ticker symbol is, how to find a company, what numbers you need to pick a stock, and how to find them. There is so much push for kids to start investing, but who out there explains it?
Investing can focus on either long term or short term holdings. I invest for the long term, hence the name of my blog; Compounding Snowballs. You want to take money that will be okay if it is put aside money for span of at least 5-10 years like college funds. Holding money in one stock for many years can be difficult, that's why patience is key. This money you invest will grow and grow but it takes time. When I am talking about long term investments I want to stress that the money that you put into these investments are not meant to be sold within 5-10 years.
How Do I Find a Company?
First, you want to find a company you are interested in. How do you do that? My trick is simple and easy to remember, just look around at things you are in contact with daily. You want to notice little simple things like post-it notes. Is there something that a lot of people are buying or are using?
Next, ask yourself if you think they will still be using and buying it in 5-10 years? These questions help stabilize my opinion on teenage trends. Teenage trends are known to last very short amounts of time, they are phase like. Yes, of course, when they're hot and popular you can make a lot of money, but how can you predict the end of that phase? You want to invest in something that has and will continue to stand the test of time. Consumer staples for example, those are simple, understandable things like toothpaste, shampoo or things you can find in your kitchen cabinet.
Then, once you narrowed your list down ask yourself if the company is on the right track, do you believe they can continue to grow? Maybe with the same product(s) as they have now or different ones. If so, do you think that there will be competitors and will they be able to beat them?
My main tips is to find things you are familiar with. Recently, an eighth grader asked me to help him to start investing. I told him to do the same things that I am recommending now. He came back with a list of about 20 companies, easy. There was a large range of stocks from Johnson and Johnson (JNJ) that sell soap and conditioner to Nike (NKE) that sells athletic wear. I noticed a pattern, probably without even thinking about it he selected simple companies that we interact with on a daily basis. As an eighth grader these are the companies that are on our radar, I will have a table of some of the stocks he came up with at the bottom of the post. He came up with good companies that tended to say away from trends or have shown to be successful and profitable over many years.
Metrics You Need
After you make a list of companies that you are interested in and have a competitive advantage you have to find a way to research them at a deeper level. For the rest of this post, I am going to use the company Johnson & Johnson (JNJ) as my example. Johnson and Johnson is a pharmaceutical company, they sell things like bandaids, shampoo, conditioner, etc.
The first step to researching a company is to find their ticker symbol. All you have to do for that is look up on Google Finance to see if that company is publicly traded. If so normally a chart will show up and you can find the ticker symbol right next to the company’s name.
From there, I use Morningstar to research the financial metrics. To do that you want to go to Morningstar and search the ticker symbol (example JNJ) in the quote box.
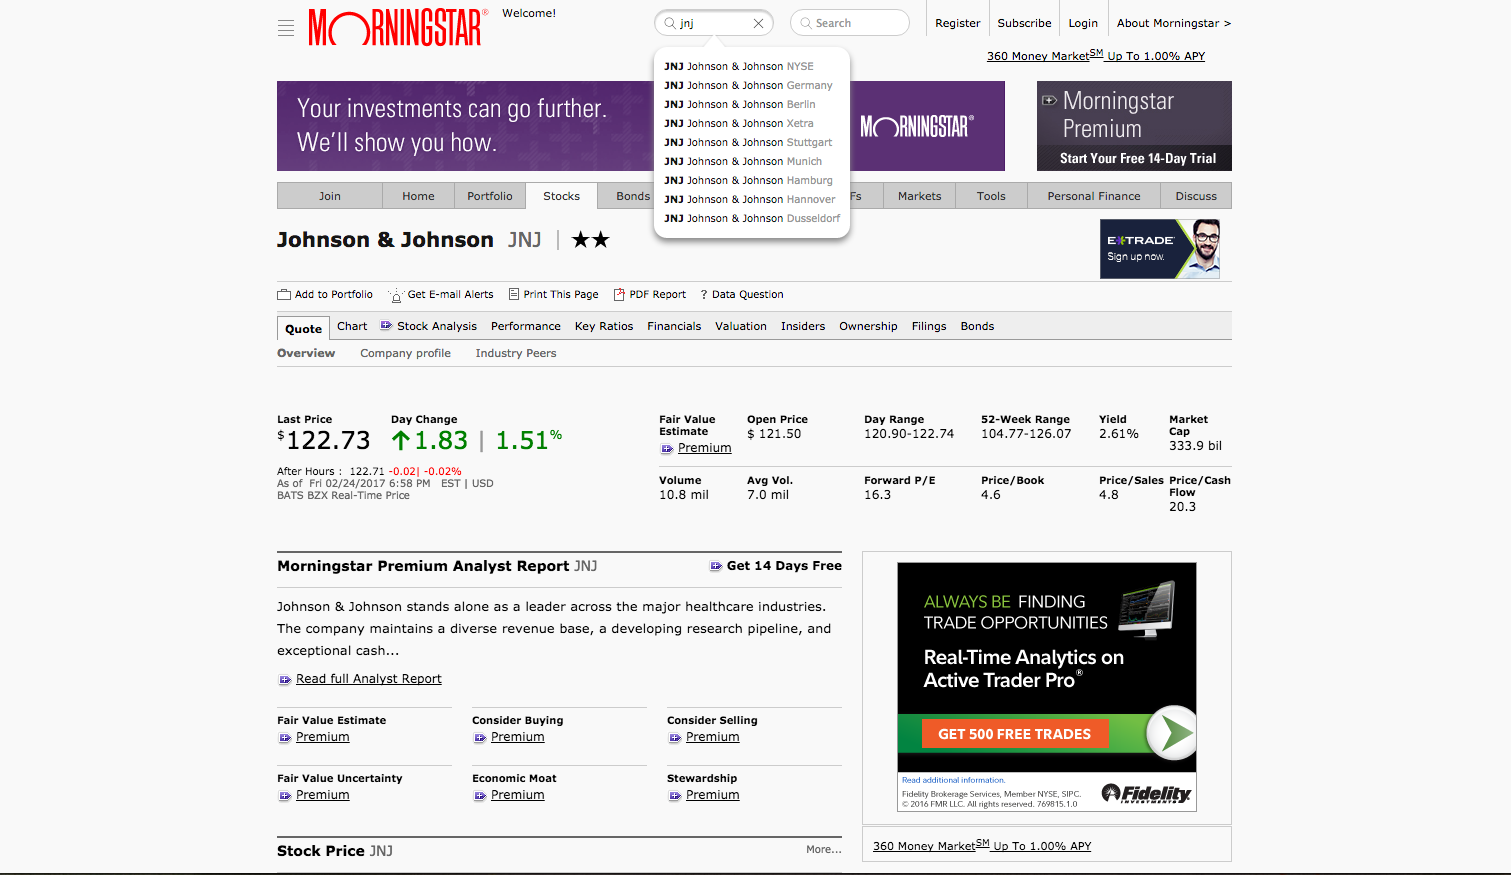
Once I get to the company's page I want to find the specific metrics. You want to look for these numbers; Price to Earnings Ratio (P/E), Dividend (Yield), Debt, Return on Equity (ROE), and Gross Margin. If you don’t know what these are please reference my Lemonade Stand series.
Yield should show up on this first page. It is on the top row on the right side of the page.
Yield should show up on this first page. It is on the top row on the right side of the page.
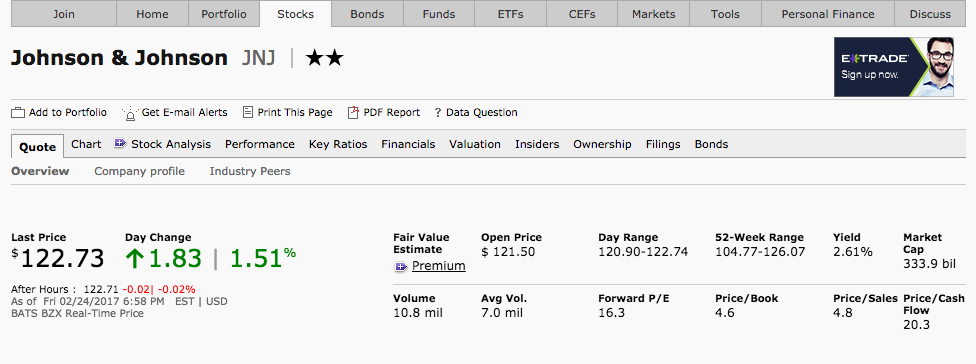
Once you’ve found the metrics you need to check if it meets my requirements. My Dividend/Yield requirement is between 2-5%. Johnson and Johnson’s is 2.6% so it meets my requirement. Next, you want to scroll down the page to find this table called Key Stats.
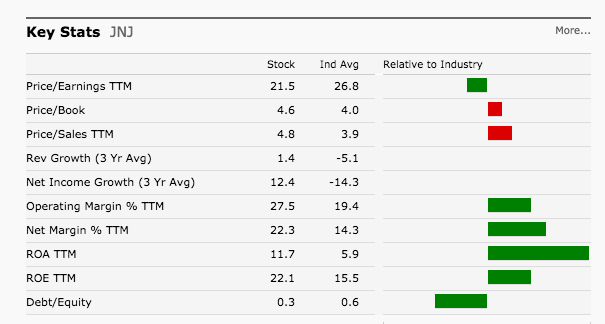
Then, you want to look at Price to Earnings Ratio (Price/Earnings). P/E is comparing the price of the company to the share price to the earnings the company makes. For P/E my requirement is 20 or under. Johnson and Johnson’s P/E Ratio is slightly over my requirement at 21.5, but not too much to worry.
Next is ROE. Return on Equity measures the profitability of a company. The ROE’s requirement is 15% or higher. It’s at 22.1 so it does meet my requirement.
Last but not least is Debt. That should ideally be under 1.0, this is a metric is one that you should be especially worried about if it is too high. Sometimes a company’s Debt can be justified by things such as buying another company, building a factory, etc. this metric is one that you should definitely look into.
Then, at the top of the page, there are multiple small tabs. Currently, you should be on the one that says “Quote.” If you click “Key Ratios” you will be able to find Gross Margin.
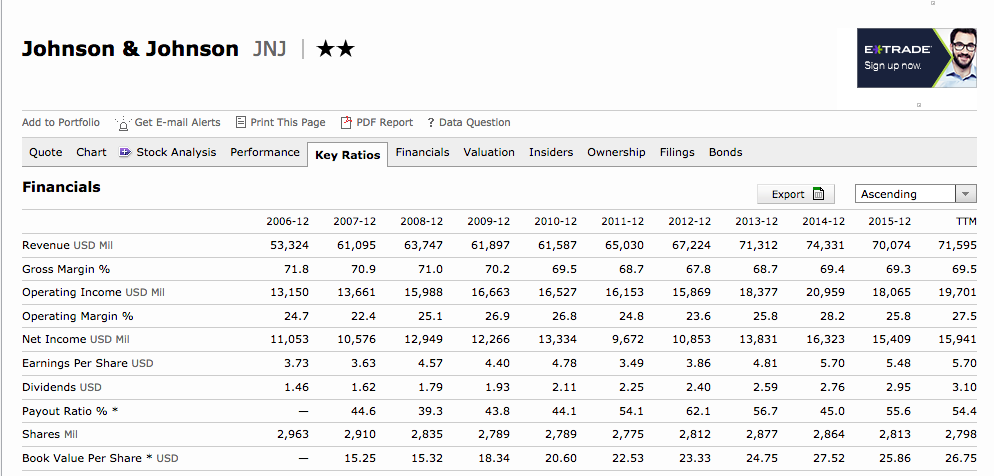
Gross Margin is in the second row. The requirement for that is 20% or higher, the higher the better because it shows the percentage of profit a company makes. As you can see there are 10 years worth of data on each metric. It is not bad to look back at the past years to see when it’s suffered or hit a high and how much it has progressed or lack of since then.
I want to recap and say that although numbers are important they aren’t the only thing that make up a company. You need to look at the company as a whole, for example, you should know what they make/do. These are the main things you need to know to start investing, once you know these basics you are ready to push your snowball down the hill.
Companies
|
P/E Ratio
20 or lower
|
Yield
2-5%
|
Gross Margin
25% or higher
|
Return on Equity
15% or higher
|
Debt
1.0 or lower
|
Snap Inc (SNAP)
|
---
|
---
|
-11.7%
|
-45.1%
|
---
|
Nike (NKE)
|
25.5
|
1.20%
|
45.4%
|
30.2%
|
0.3
|
Pepsi (PEP)
|
25.3
|
2.72%
|
55.1%
|
54.7%
|
2.7
|
Amazon (AMZN)
|
174.3
|
---
|
35.1%
|
14.5%
|
0.8
|
Target (TGT)
|
10.7
|
4.12%
|
29.9%
|
27.5%
|
1.1
|
Sony (SNE)
|
---
|
0.56%
|
24.9%
|
-1.6%
|
0.3
|
Hasbro (HAS)
|
22.5
|
2.09%
|
53.9%
|
31.3%
|
0.6
|
Mattel (MAT)
|
27.7
|
5.97%
|
46.8%
|
12.6%
|
0.9
|
Apple (AAPL)
|
16.7
|
1.63%
|
38.5%
|
34.7%
|
0.6
|
American Eagle Outfitters (AEO)
|
11.7
|
3.34%
|
37.8%
|
20.1%
|
---
|
Johnson and Johnson (JNJ)
|
20.9
|
2.59%
|
69.8%
|
23.4%
|
0.3
|
Disney (DIS)
|
20.0
|
1.35%
|
46.0%
|
20.6%
|
0.3
|
Footlocker (FL)
|
16.5
|
1.45%
|
33.9%
|
24.4%
|
---
|
Coca-Cola (KO)
|
28.5
|
3.32%
|
60.7%
|
26.9%
|
1.3
|
Kohl’s Co. (KSS)
|
12.8
|
5.20%
|
35.9%
|
11.3%
|
0.9
|
VF Corp. (VFC)
|
18.9
|
2.89%
|
48.4%
|
20.8%
|
0.4
|
Comments
Post a Comment