
Profit Margins:
We are going to start with Profit Margins. This story will take you step by step on how to calculate the Profit Margins of any company you have interest in. Sources such as Morningstar and Motley Fool help you find the exact calculations without doing the research but you should at least know how to find the data you need and how to calculate it. As an investor it’s important to know why I’m making you read this post, why I’m even talking about this. Well, it’s because the money or the profit that the company makes determines how much the investors will get.
There are many kinds of Profit Margins. Think of it like a book, the section is Profit Margins but to calculate it there are many ways and many different types of Profit Margins. The most common one is called Net Profit Margins. First we are going to look at a big picture idea, showing Lily and Sara’s Lemonade Stand’s Profit Margins. Next, we are going to look at NPM(Net Profit Margins) for real companies, Walmart and Johnson and Johnson.
Lily and Sara are selling their lemonade for $0.50 a cup. Farhang bought $8.00 worth of cups, sugar, and lemons for the two girls to start their lemonade stand. If they sold $10.00 worth of lemonade and had to pay $8.00 back to Farhang. What is their Profit Margin?
Let’s calculate together. If they spent $8.00 on the ingredients and subtracted that from the amount they sold $10.00, you would get $2.00 of profit. Then you would divide $2.00 by $10.00 which would give you one/fifth, otherwise known as 20%. When the girls sell $10.00 worth of lemonade they would have a 20% Profit Margin.
$10.00(of Revenue) - $8.00(the cost of the ingredients) = $2.00(of profit)
Now on to NPM (Net Profit Margin). It’s an easy but very helpful tool. Let’s first learn how to calculate it and then look at some examples. To calculate Net Profit Margins you need to know a few vocabulary words. Net income: Net Income is the profit that the company makes. In the lemonade stand example, the girls Net Income was $2.00. The last word is Revenue, that is not the same thing as income. Revenue is all the money that the company earns, again, Lily and Sara’s Revenue is all the $10.00, it’s profit and all.
We explained how to calculate income, but as a recap, you take how much you made and subtract that from the total cost of the items you needed to buy to make the company’s product. For example, when Farhang paid for Lily and Sara’s lemonade stand he had to buy all the ingredients so they could make their lemonade. It ended up having total cost of $8.00. To calculate NPM you have to complete three steps.
- Find the Net Income.
- Then divide the Net Income by the Revenue.
- That brings us to your total percentage of Net Profit Margins.
It’s important to know three things. When you divide the Net Income by the Revenue it means that the Net Income goes into the Revenue. The second thing is when you’re looking at stocks to invest in you want to check and see what the difference between the NPM of the company compared to the Industry Average. Preferably the company’s NPM is higher than the Industry average. The third thing is where you’re looking. You can find the industry average of most metrics next to the metric you are looking at, for all the example in this post I am using the data source Morningstar.
Now, let’s look at some examples.
I am going to use Johnson and Johnson v.s. Walmart. Johnson and Johnson is a medical company, they make toe tape, medicine, medical devices, body wash, shampoo and so much more. Walmart is a chain store that sells groceries, school supplies, Polaris golf carts and much more.
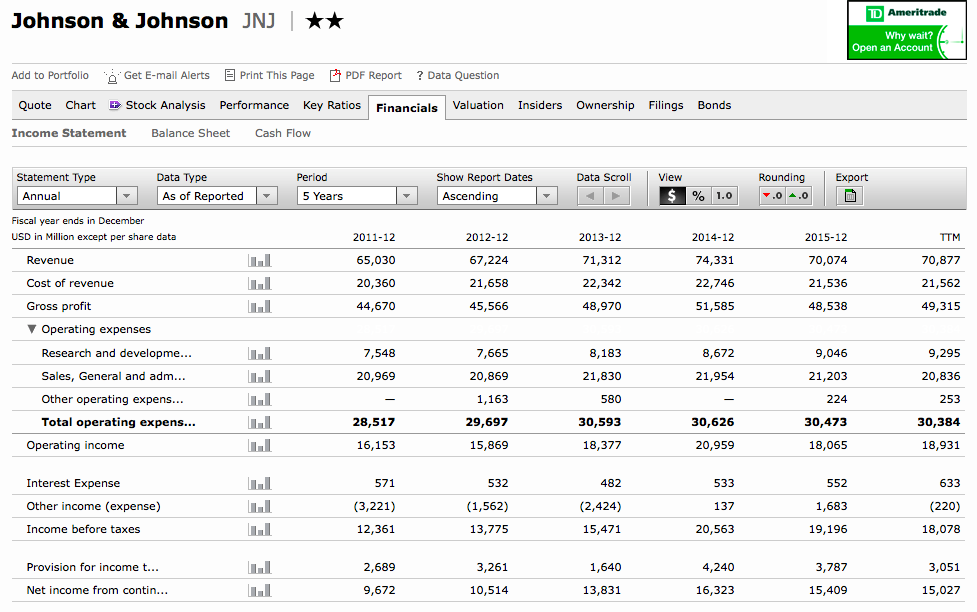
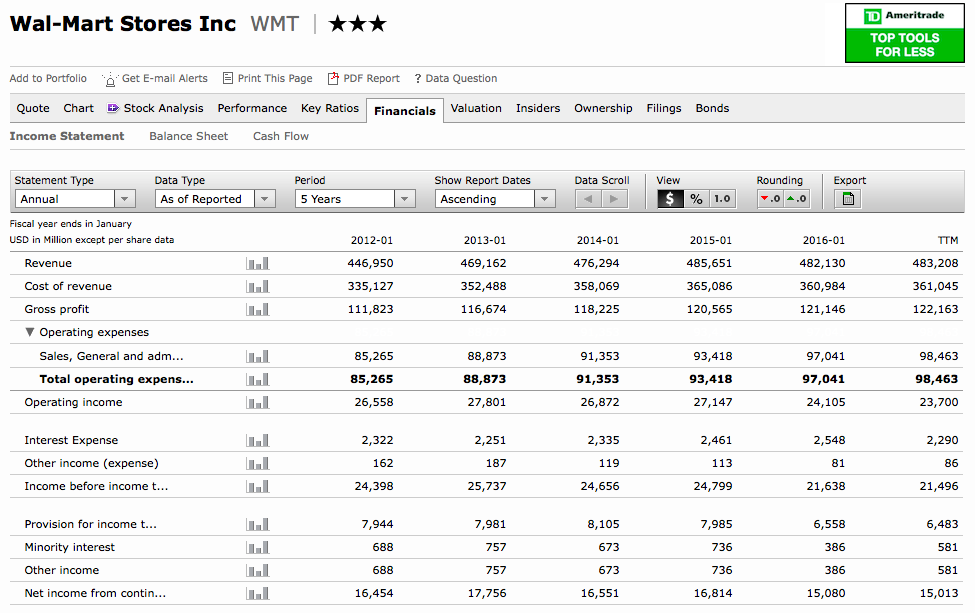
When you look on your preferred website (remember, Motley Fool or Morningstar are two options) to find the data for a stock you want to look for two things the Net Income and Revenue. First, we will look at Johnson and Johnson, ticker: JNJ. Their Revenue for 2016 is $70.8 Billion and their Net Income is $15 Billion. Now what we want to do is divide $15 Billion by $70.8 Billion. That gives us a NPM of 21%, meaning for every dollar Johnson and Johnson makes for Revenue the company earns $0.21. If we look at Walmart they have a Revenue for 2016 of $483 Million and a Net Income of $15 Million. When we do the division that would give us 3%, meaning, again, for every dollar they make as Revenue they keep $0.03.
$15,013(Net Income) / $483,208(Revenue) = 3%
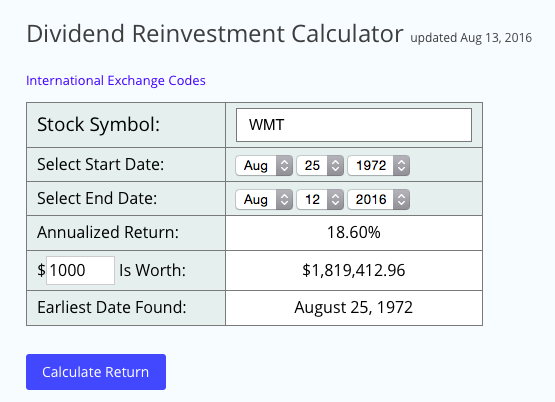
If I went to Walmart and spent $100, then Walmart would only make $3.00 of profit. Which means as a consumer they are giving us cheap products, but for a short term investor, it isn’t ideal. If I bought $100 of Johnson and Johnson products, they would make $21.00. Walmart may look like a bad stock for short term investing, but look at the long run.
If we look at Walmart’s long run compounding. After 44 years they made over one million dollars. I used longrundata.com to find this information.
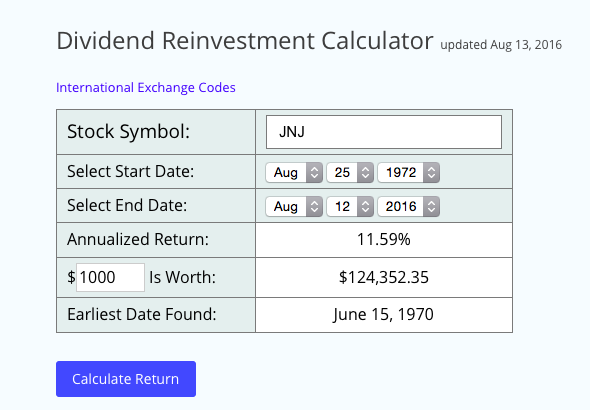
Johnson and Johnson didn’t do so badly either over the same 44 years.
It’s also important to see if the company’s Profit Margins are increasing or decreasing. Let’s look at the past five years. As you can see they both were pretty consistent. Over five years Johnson and Johnson went up six percentage points compared to Walmart’s zero.
Profit Margin Comparison
2012
|
2013
|
2014
|
2015
|
2016
| |
Johnson and Johnson
|
15%
|
19%
|
21%
|
21%
|
21%
|
Walmart
|
3%
|
3%
|
3%
|
3%
|
3%
|
Next, we will be talking about debt. You will get to hear more about Lily and Sara’s lemonade stand. After that, you still get to look forward to stories about P/E ratio and dividend! Please post comments and questions below. I would love to answer them.
Comments
Post a Comment